Author: Jeroen de Vos, humanities scholar, entrepreneur and research assistant at DATACTIVE.
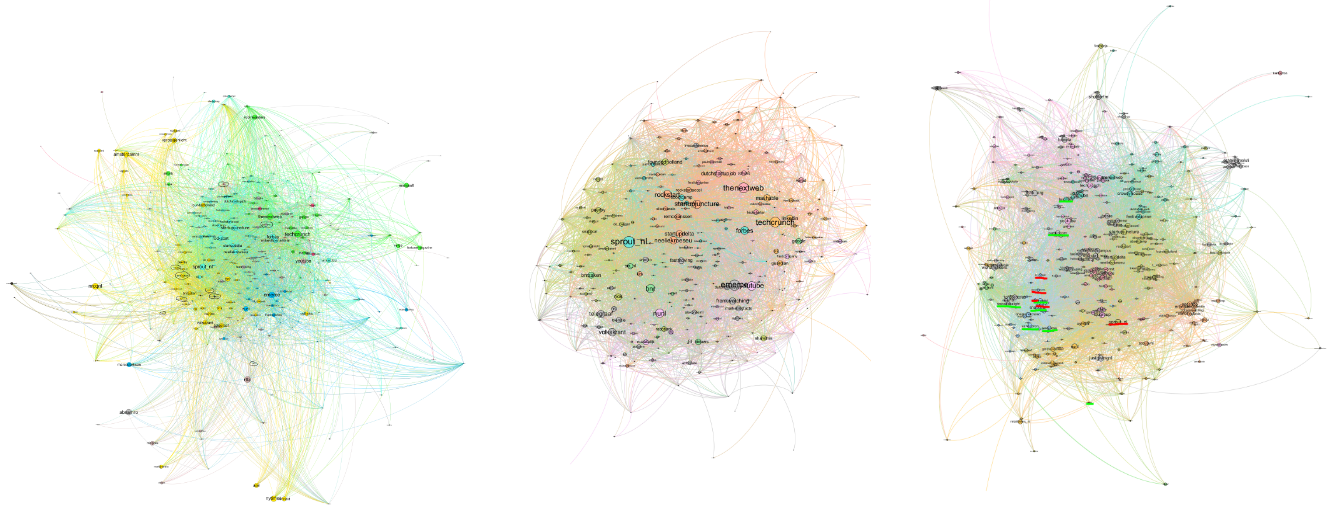
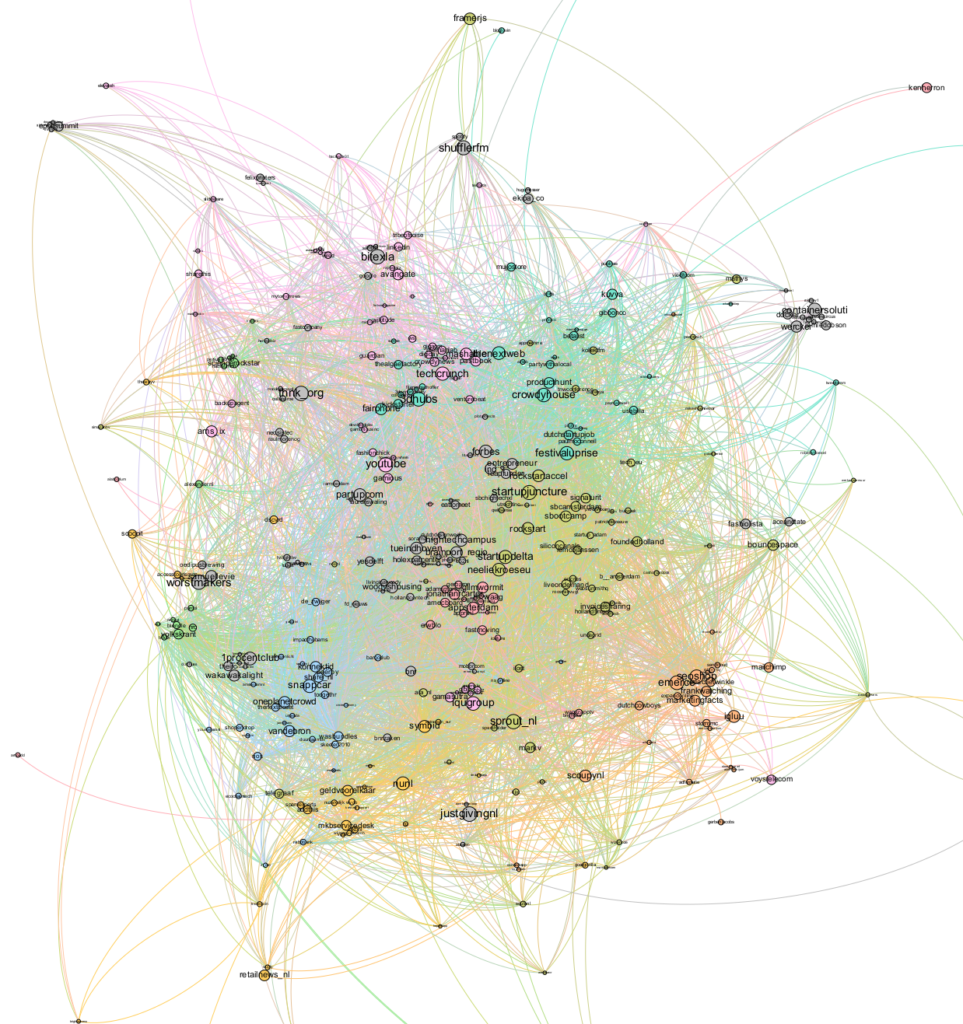
How do the graphs above differ? With their different colors, layouts and visual densities, they seem to each adhere to their own unique network. However, as an image they consist of the same kind of materiality: a network plotted in nodes and edges, dots and their connections, actors and their ties. What if I would say they actually present exactly the same network? That would challenge our notion of a network as one uniformly tangible, portrayable, showable and renderable object. This short blogpost will introduce ‘collaborative reading’ as a method to question the affordances these graphs have in a research setting -it reflects DATACTIVE’s quest for more mixed- and interdisciplinary research methods.
Collaborative readings
It builds on a larger research effort to map the Dutch entrepreneurial ecosystem using mixed methods, which combined an analysis of the Twitter-data of Dutch startup entrepreneurs with exploratory semi-structured interviews. In such interviews, I would introduce one of the graphs above to any of the Dutch entrepreneurs in question, together with a descriptive explanation of the method and logic of its production. This would look something like: [Every node [dot] represents a Twitter user account / If one user mentions another, this creates an edge [link] between the two nodes / The more mentions, the stronger the traction between the nodes / The node size represents a number of times the user is mentioned / The colours express statistical communities]. I would leave the floor open to see how the interviewees reacted, and in a follow-up question invite them to interpret the graph for me. Obviously, the process of triangulating the product of social network analyses by providing it to the subject of research is as old as early anthropological attempts to annotate kinship structures through early categorization practices (ie. Anthropologist Lewis Henry Morgan, 1818–1881). However, just giving back a networked representation as a form of consent or reciprocity is different from an actively collaborative reading the graph in question. Internalizing the validation of your methods through the practice of collaborative readings can serve multiple purposes.
Complications
This technique, that is clearly resonating with other naive interview techniques (DeWalt & DeWalt, 2010), helped to flesh out the role of the graph as an actor intervening in the space between the interviewee, the researcher, the Twitter accounts in question, and the colorful dots that represent their contested place in a field of other actors.
- The first complication of using these network graphs was the fact that as a researcher, one often has little explanation for the statistical correlations that are continuously rendered in various network plots. Since these networked correlations are not self-evident, every methodological step taken to work towards a single readable visual network can be challenging. The researcher often has little understanding of the underlying mechanism that could either support or discourage a particular way of plotting. This problem coincides with the discussion between social- and data scientists on the question whether data-correlations are self-explanatory, or that we still need a man-made hypothesis to allow structural knowledge gathering (boyd & Crawford, 2012; Burrows & Savage, 2014).
- A second consequence of working with these visuals as a means to represent the ecosystem was the constant struggle over readability. With the sheer size and ‘messiness’ of network representations, the collaborative reading consisted of much panning in zooming. It shows the inherent constraints of forcing a (3d) network to be visualized on a small rectangular screen, and other researchers experimented with other ways to plot a network graph, as a poster, a large map on the floor in which actors can be enacted. Nevertheless, the mere size and inclusivity of larger network representations inevitably force to constantly switch, in which the overview will typically be as insightful as the detail.
- Lastly, with its graphical inclusivity, many respondents read the networks as some form of entirety. Rather than providing a self-contained overview, the Dutch entrepreneurial ecosystem is produced through a series of very specific sociotechnical criteria. This is the result of many people sending tweets in a particular context, often with an (imagined) audience in mind – data which is re-appropriated for mapping purposes. The subsequential visual representations clearly demarcate one set of actors which evokes an understanding of the entrepreneurial ecosystem which might be somewhat superficial. The graphs float in a void like the contours of a nation-state map. They thereby surpass the idea that any peripheral node is again center of other social networks inherent part of any network analysis.
What ecosystem
Which brings me to my last point, regarding the contribution to entrepreneurial ecosystem studies. The study of ecosystems arose from the socioeconomic economic cluster analyses. From early comparative research comparing the proliferation of (mostly US-based) economic clusters in the 1980s (Saxenian, 1996), the effort to map and understand the entrepreneurial ecosystem infused with the promise to reproduce success (Hospers, Desrochers, & Sautet, 2009; Moore, 1996). This lead to many scholars and experts in the field contributing to case-studies and ideal types (Feld, 2012; Isenberg, 2011). However, the notion of an economic cluster as an ecosystem might be criticized. Drawing on the biological metaphor of ‘a heterogeneous set of interdependent living and nonliving actors’, the ecosystem metaphor is used to denote an inherently closed system in which everything coexists into some form of natural equilibrium. It presupposes the same kind of delimitations that is one of the pitfalls of the network graphs above: in their serenity, they invite to interpret an all inclusive and finalized representation. Instead, this post is meant to invite to think beyond the delimited ecosystem analyses, to be able to create a more flexible framework which can better bare notions of messy, unfinalized and impartial perspectives. What would such a representation look like?
For more information:
See the research website or the full thesis, or simply drop a line using jeroen@data-activism.net
This research project has originally been established with the help of Dealroom and in a collaboration with Digital Methods Initiative [UvA].
References
boyd, danah, & Crawford, K. (2012). CRITICAL QUESTIONS FOR BIG DATA: Provocations for a cultural, technological, and scholarly phenomenon. Information, Communication & Society, 15(5), 662–679. https://doi.org/10.1080/1369118X.2012.678878
Burrows, R., & Savage, M. (2014). After the crisis? Big Data and the methodological challenges of empirical sociology. Big Data & Society, 1(1). https://doi.org/10.1177/2053951714540280
DeWalt, K. M., & DeWalt, B. R. (2010). Participant observation: A guide for fieldworkers. Rowman Altamira.
Feld, B. (2012). Startup communities: Building an entrepreneurial ecosystem in your city. John Wiley & Sons.
Hospers, G.-J., Desrochers, P., & Sautet, F. (2009). The next Silicon Valley? On the relationship between geographical clustering and public policy. International Entrepreneurship and Management Journal, 5(3), 285–299.
Isenberg, D. (2011). The entrepreneurship ecosystem strategy as a new paradigm for economic policy: Principles for cultivating entrepreneurship. Institute of International European Affairs, Dublin, Ireland.
Moore, J. F. (1996). The death of competition: leadership and strategy in the age of business ecosystems. HarperCollins Publishers.
Saxenian, A. (1996). Inside-out: regional networks and industrial adaptation in Silicon Valley and Route 128. Cityscape, 41–60.